Manual
version: V1.2.3
Overview
HELIS is software designed to estimate the helical parameters based on Cryo-ET data.
The software contains two levels fo functions, tomogram-level and filament-level
- Tomogram-level: tomogram visualization, coarse filament picking, et al.
- Filament-level: filament modification, helical parameter estimation, et al.
In the Tuning filament mode, the filament-level functions are accessible, otherwise the tomogram-level functions are available.
The graphical user interface (GUI) of HELIS consists of two main regions
- Control Panel: left part of the GUI, includes buttons and a list box for managing filament data
- Visualization Area: right part of the GUI, displays the tomograms and filaments (switch by clicking the tabs).
- Tomogram View: displays the slices of the tomogram and the filament axes, allowing users to coarsely determine and check the filament positions.
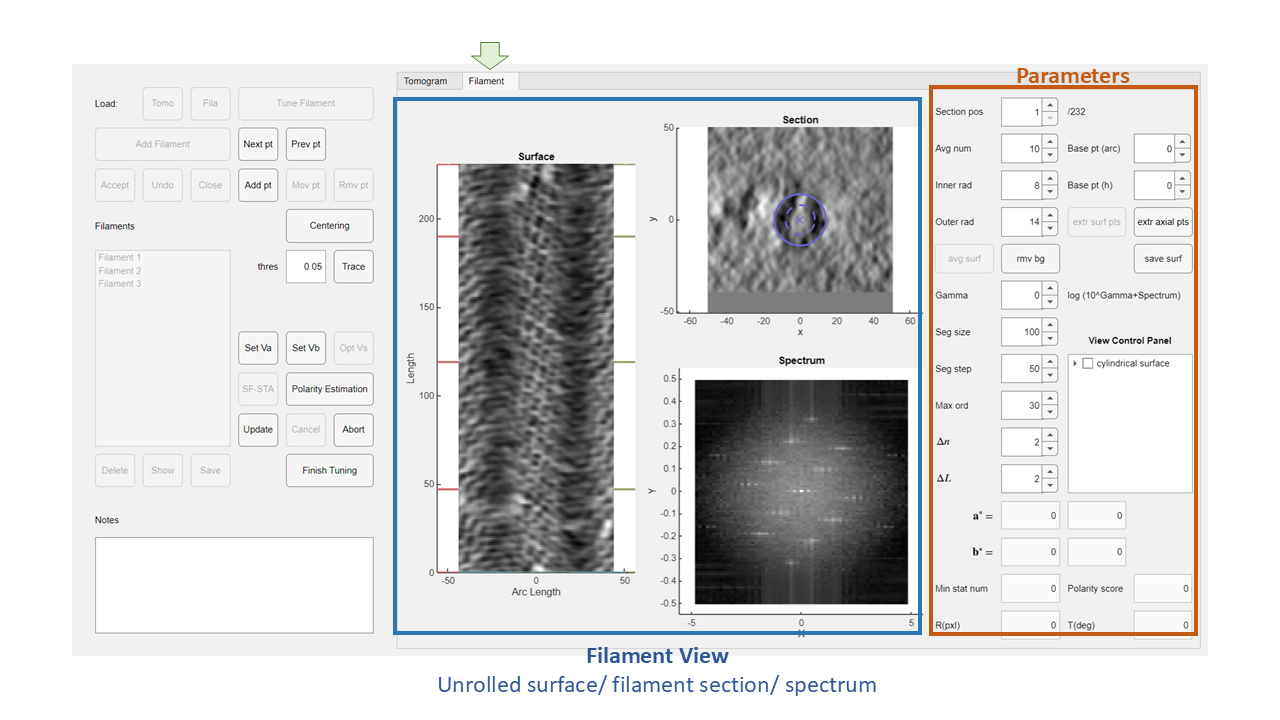
- Filament View: contains three sub-views: the averaging cylindrical surface, the cross-section, and the unrolled Fourier spectrum. These sub-views collectively provide intuitive insights into the selected filament, enabling users to precisely tune filament axis positions and determine helical symmetry.

Load Data
Tomo button: select and load a tomogram file.
- Only
.mrcfiles are supported. - This step is required for subsequent operations.
Fila button: select and load a filament information file.
- This should be a
.matfile generated by HELIS. - If filament positions already exist, this step can be skipped.
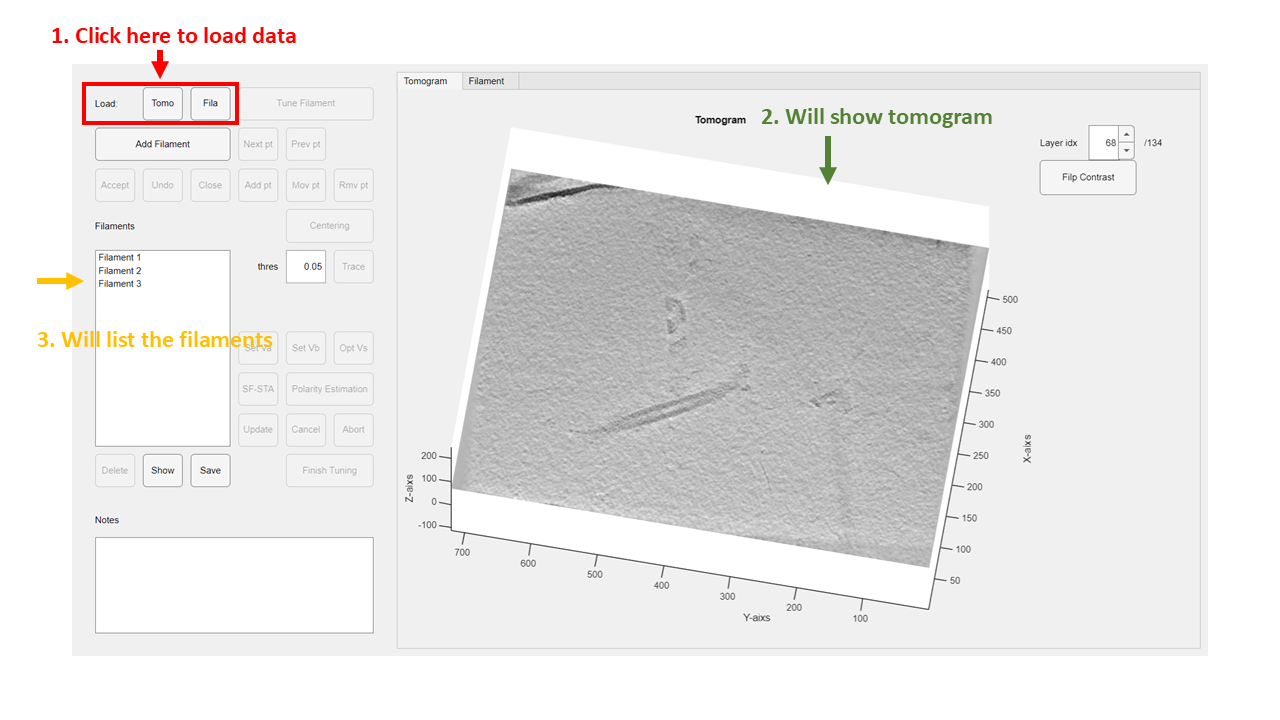
After successfully loading the tomogram and filament information, the tomogram view will display slices of the loaded tomogram, and the filament list box will list the existing filaments.
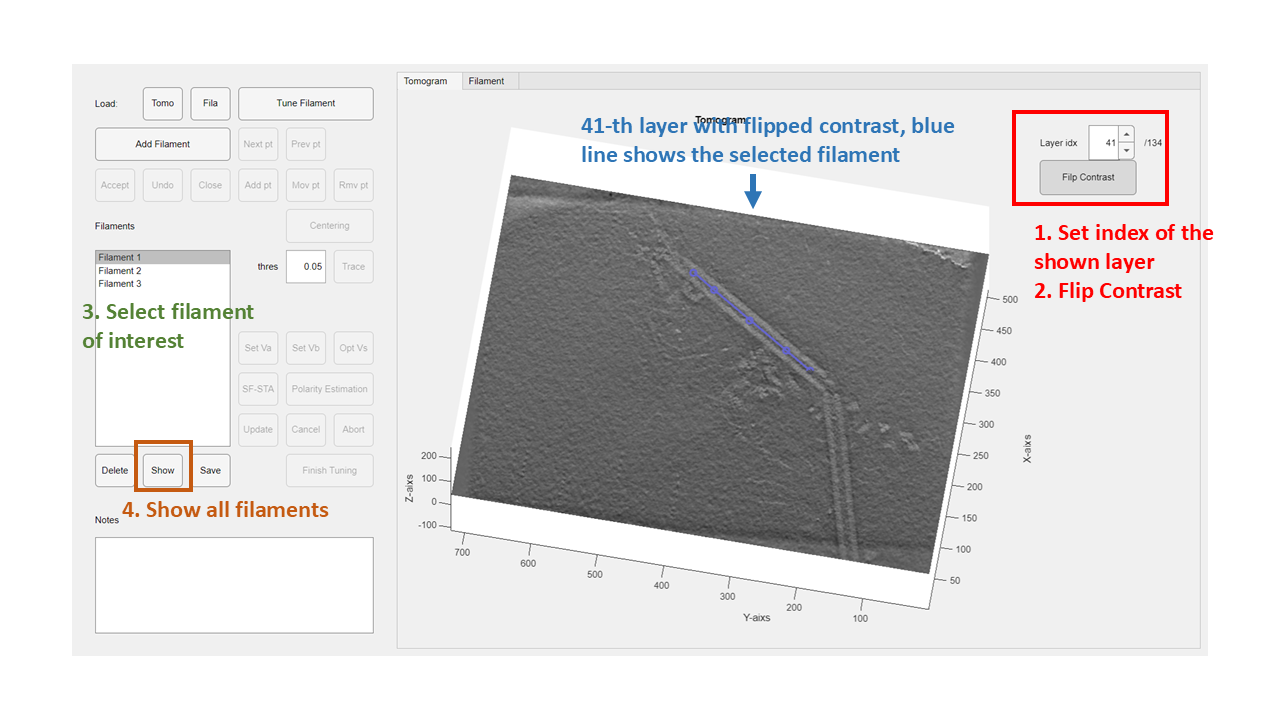
Observe Tomograms and Filaments
↑ and ↓ arrow buttons: switch up and down the displayed layer
Layer idx box: editable, the index of the displayed layer
Flip Contrast button: flip the tomogram contrast.
- This affects only the display in the GUI and does not modify the original data.
Filament list box: select filament
- Click any item in the
Filamentslist box to select the corresponding filament.
Show button: display all filaments simultaneously.
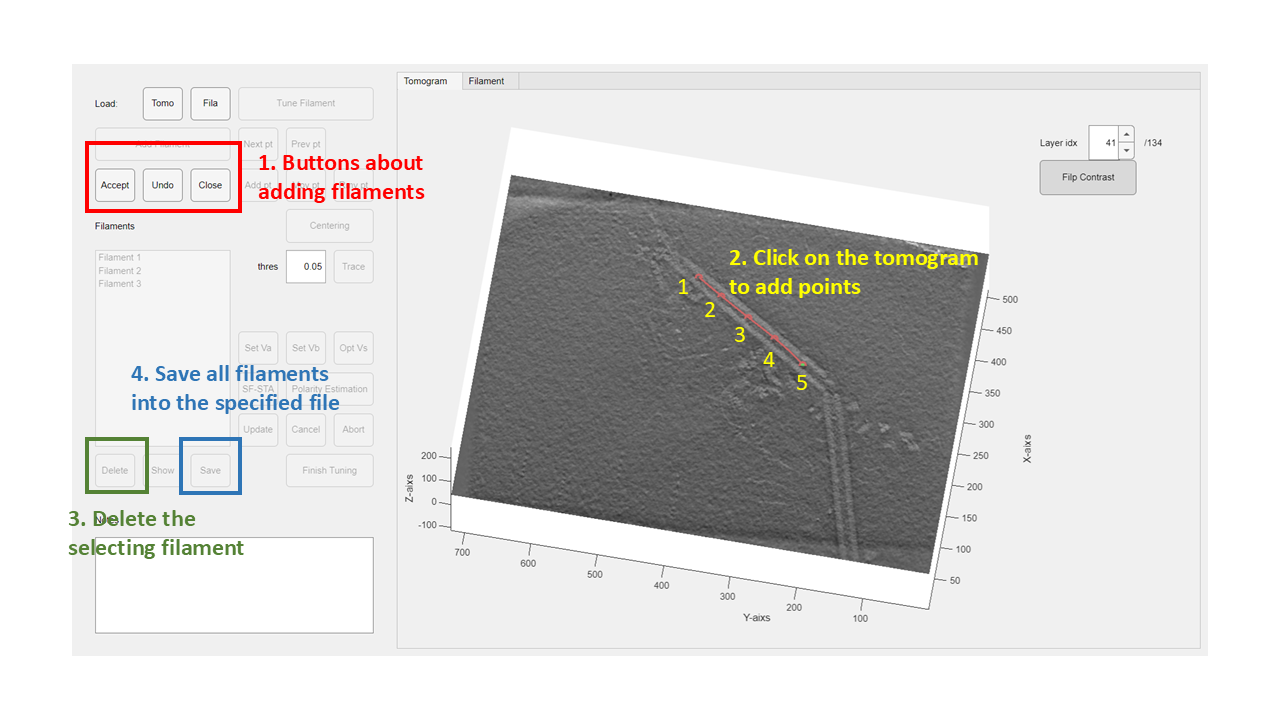
Edit Filaments
Add Filament button: enter filament-adding mode.
- Click on the tomogram layer to pick filament axis points in order.
Undobutton: cancel the previous point selection.Acceptbutton: save the selected points as a new filament and exit filament-adding mode.- The new filament will appear in the
Filamentslist box.
- The new filament will appear in the
Closebutton: discard the current selections and exit filament-adding mode.
Delete button: remove the selected filament.
Save button: save all filaments to a specified file.
Tune Filaments
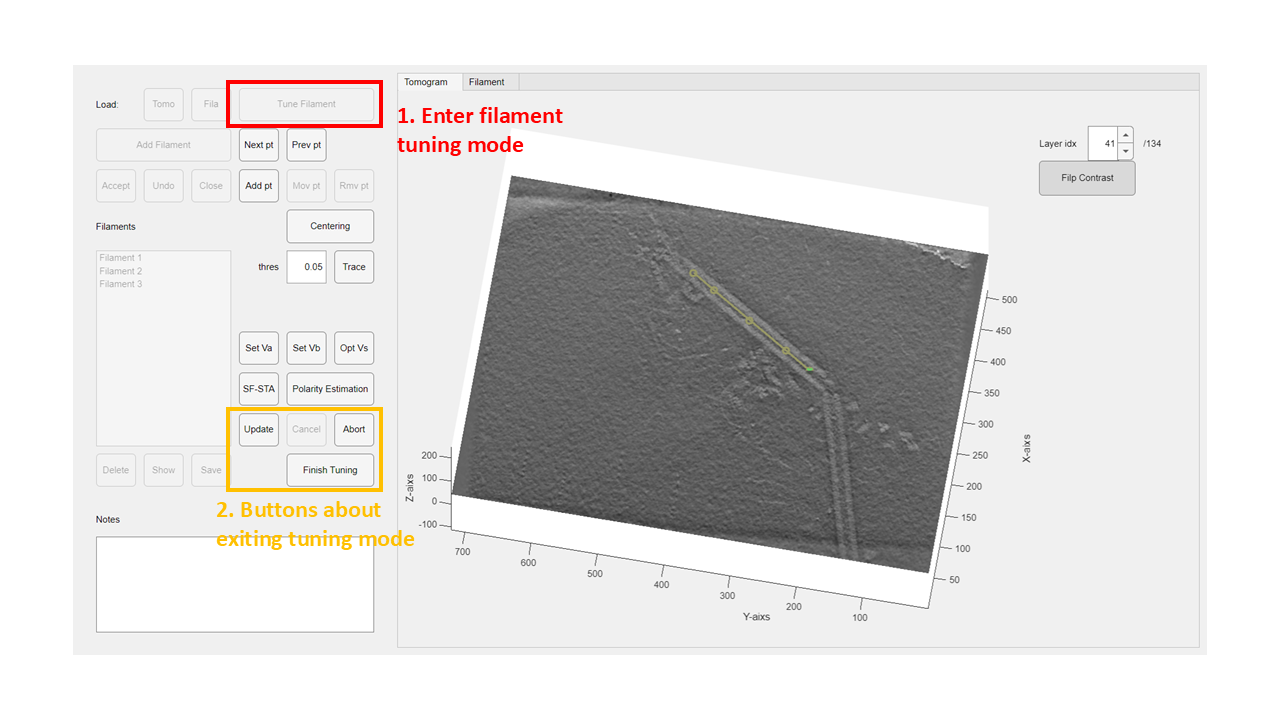
Enter & Exit Filament Tuning Mode
Tune Filament button: enter filament-tuning mode for the selected filament.
- Any subsequent operations will modify the selected filament.
- Right-click to select
Set extracting parametersfor setting key filament extracting parameters.
Update button: save modifications and refresh the filament view.
Abort button: discard all changes since the last update.
Finish Tuning button: discard unsaved changes and exit tuning mode.
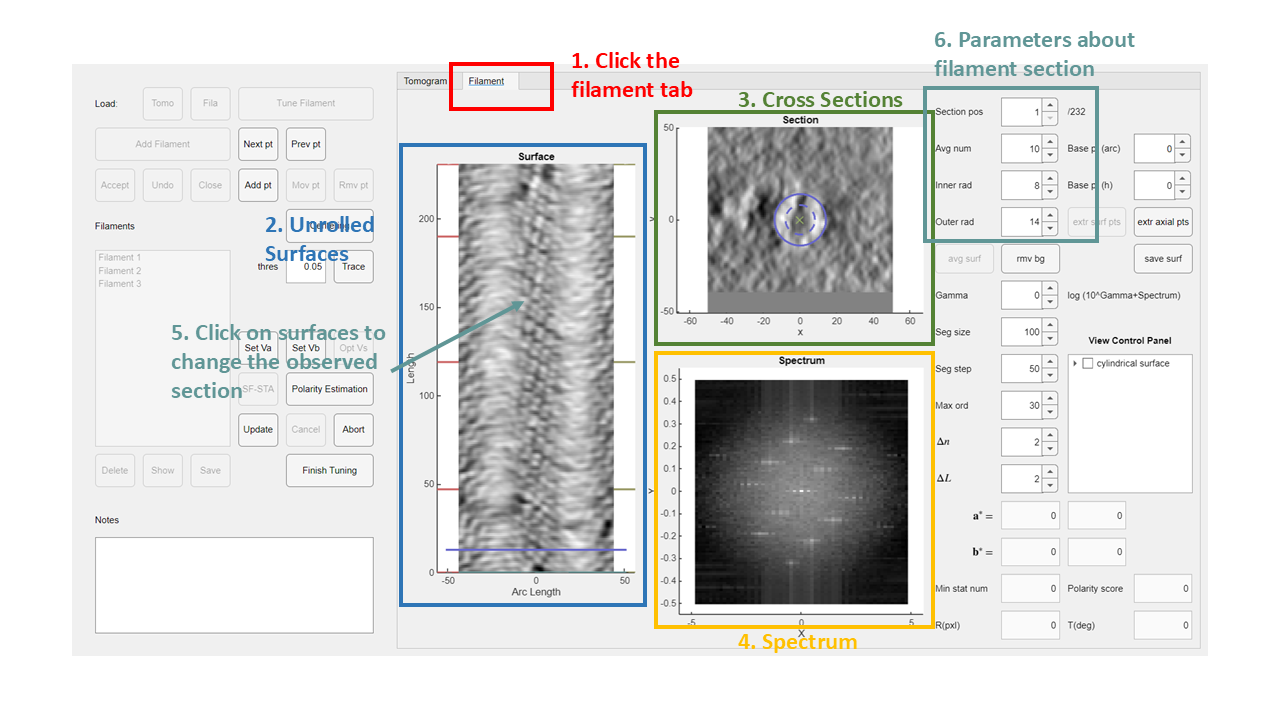
Observe the Filament View
Filament tab: switch to the filament view.
- Contains three sub-views: unrolled surface, cross-section, and cylindrical Fourier spectrum.
- Click on unrolled surface to display corresponding cross-section.
- The cross-section sub-view shows the average of several adjacent sections.
Section Pos box: specify the section's position.
Avg Num box: control the number of sections to be averaged.
Inner Rad and Outer Rad boxes: define filament's inner and outer radii.
- Displayed as two rings in the filament section figure.
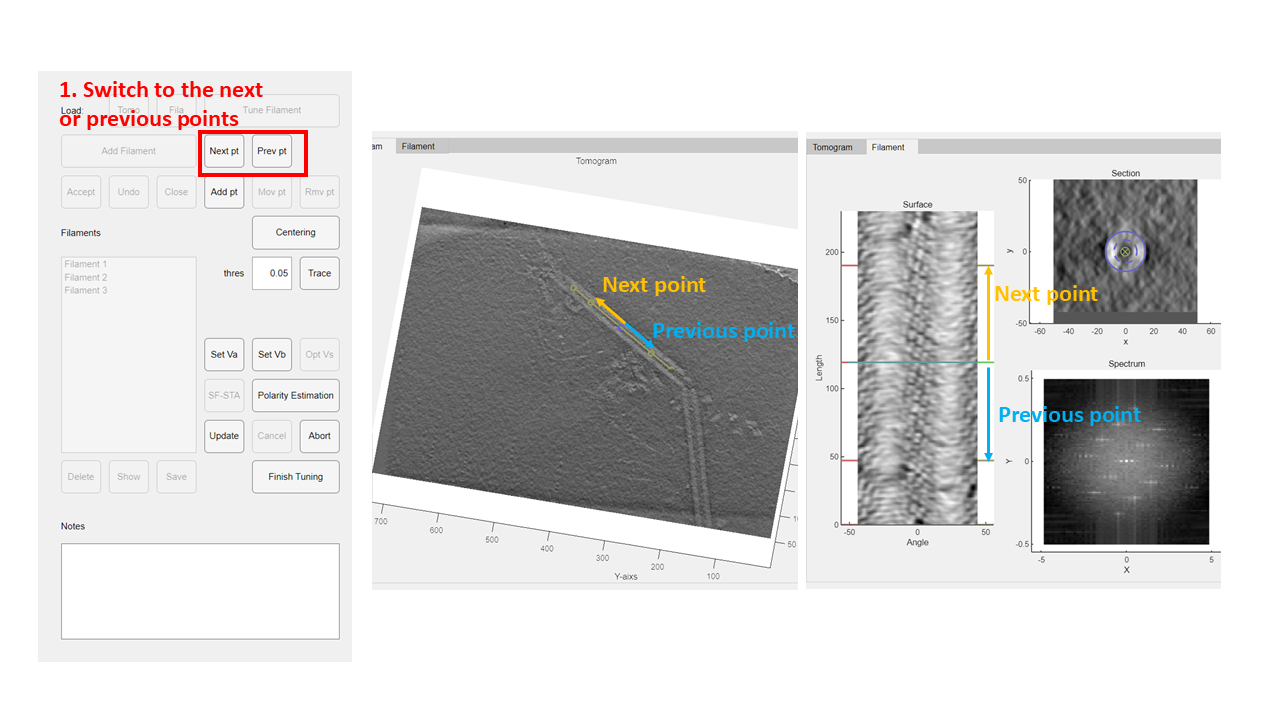
Select the Target Filament Point
Next Pt and Prev Pt buttons: navigate between points.
- Tomogram view and filament view are synchronized.
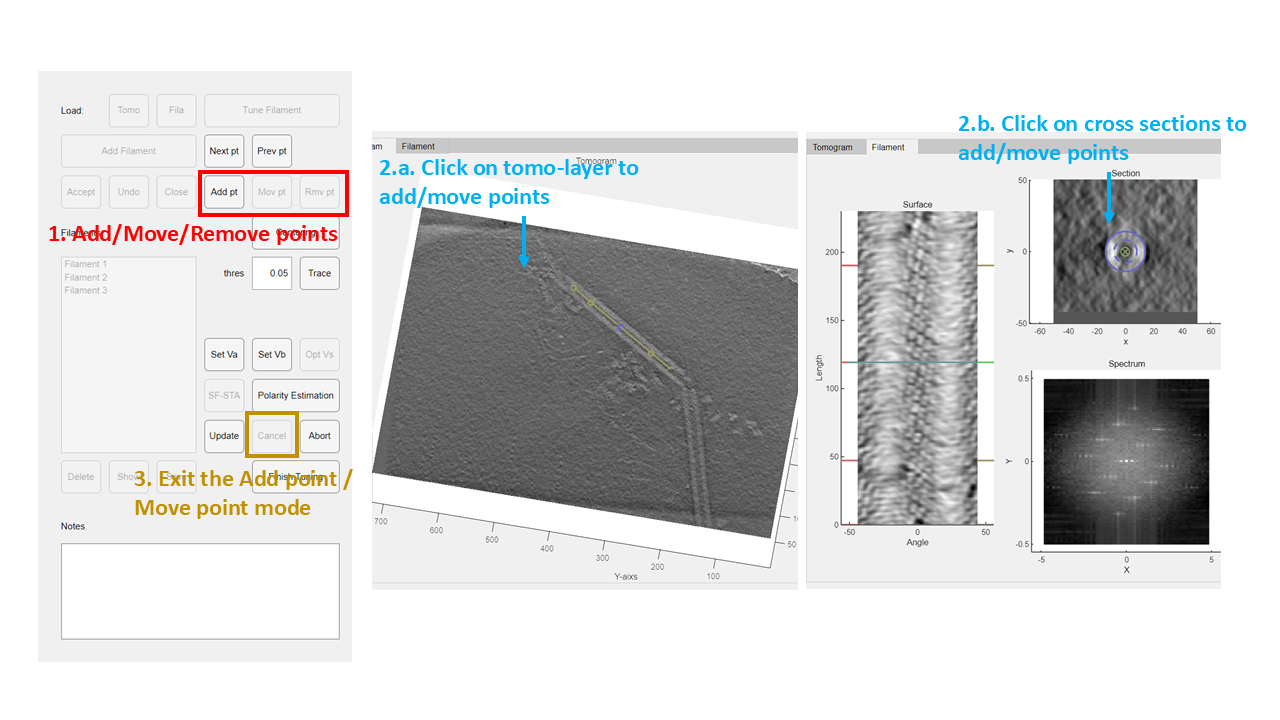
Edit Filament Points
Add Pt button: enter point-adding mode.
- Click on tomogram layer or cross-section to add new point.
- New point will be added to nearest end or between closest points.
- GUI exits point-adding mode automatically after adding.
Mov Pt button: enter point-moving mode.
- Click on tomogram layer or cross-section to move selected point.
- GUI exits point-moving mode automatically after moving.
Rmv Pt button: delete selected point.
Cancel button: exit point-adding or point-moving mode.
Note: Click Update after making changes to refresh the filament view.
Automatically Trace and Center Filaments
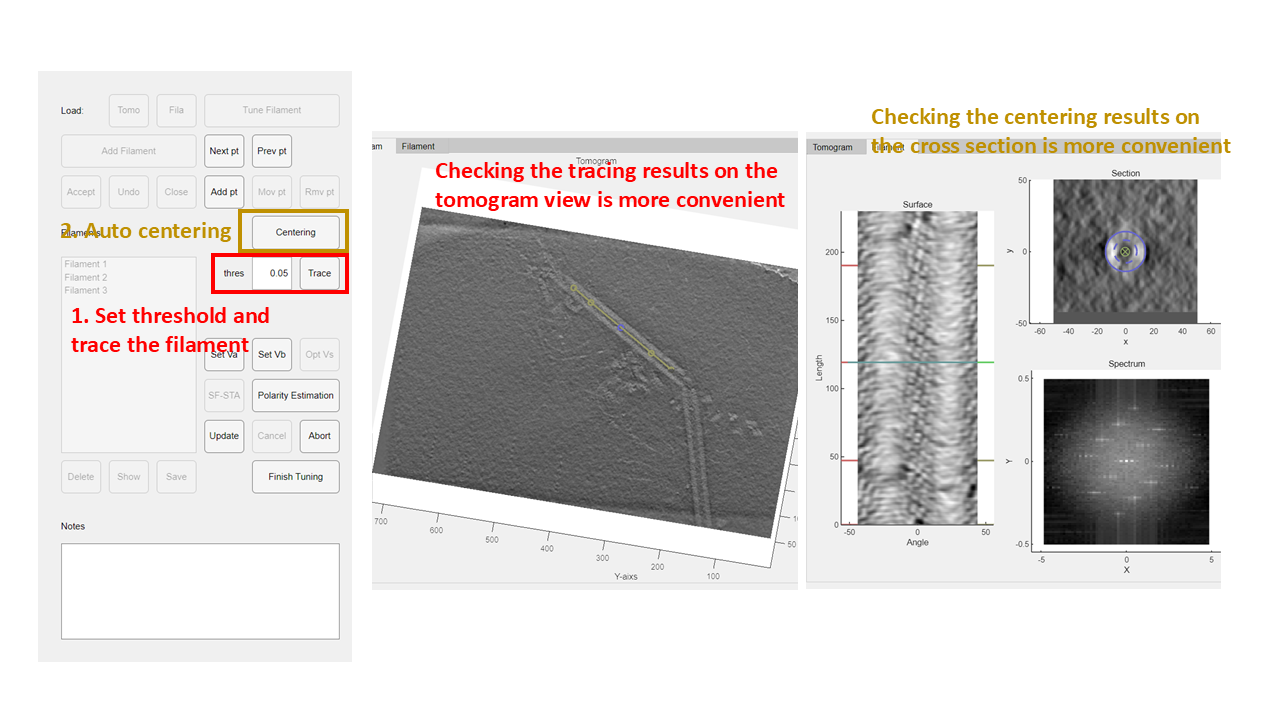
Thres box: set threshold for tracing.
Trace button: trace the current filament.
- Use tomogram layers to verify results.
Centering button: automatically find filament center.
- Uses extracted filament density map.
- Ignores newly added points.
- Update filament before auto-centering.
Determine the Helical Parameters
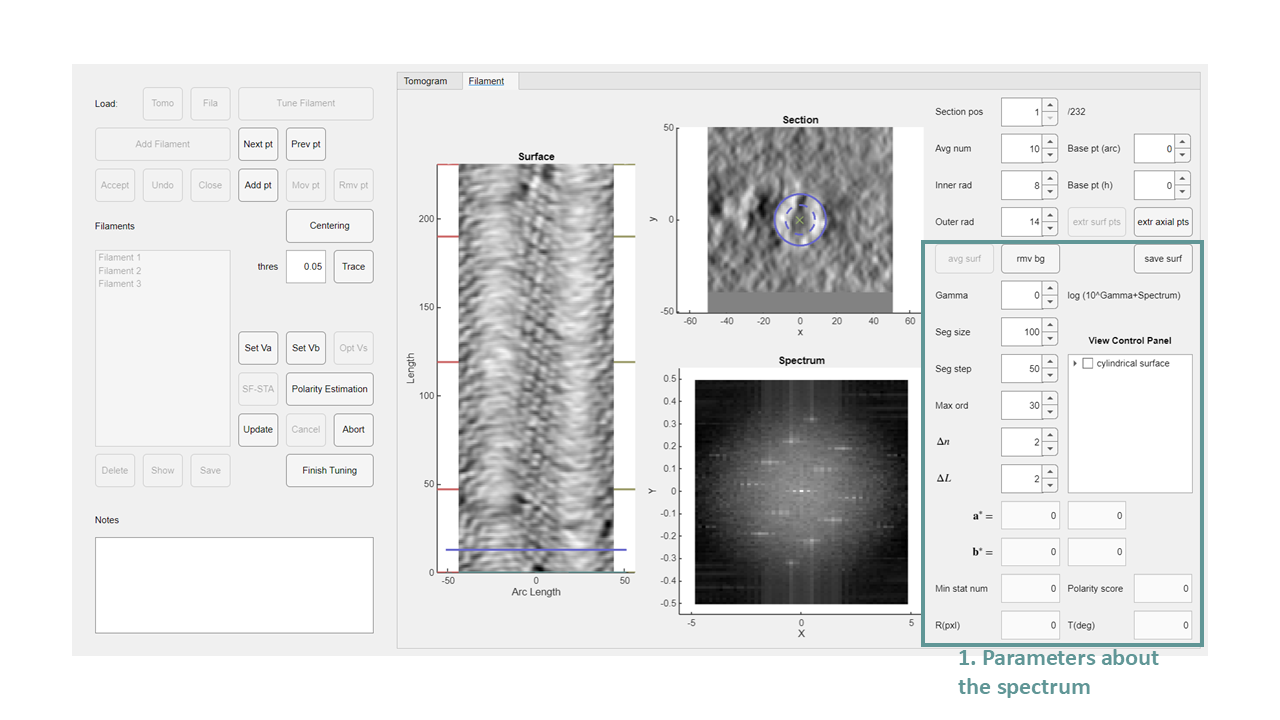
Adjust the Shown Fourier Spectrum
Rmv Bg button: remove background from spectrum.
Gamma box: adjust logarithm constant.
Seg Size and Seg Step boxes: define segment length and step size for spectrum averaging.
Max Ord box: adjust horizontal width.
Δn and ΔL boxes: define search range for vector optimization.
a* and b* boxes: display reciprocal primitive vectors (read-only).
- Star number, rise, and twist show corresponding helical parameters.
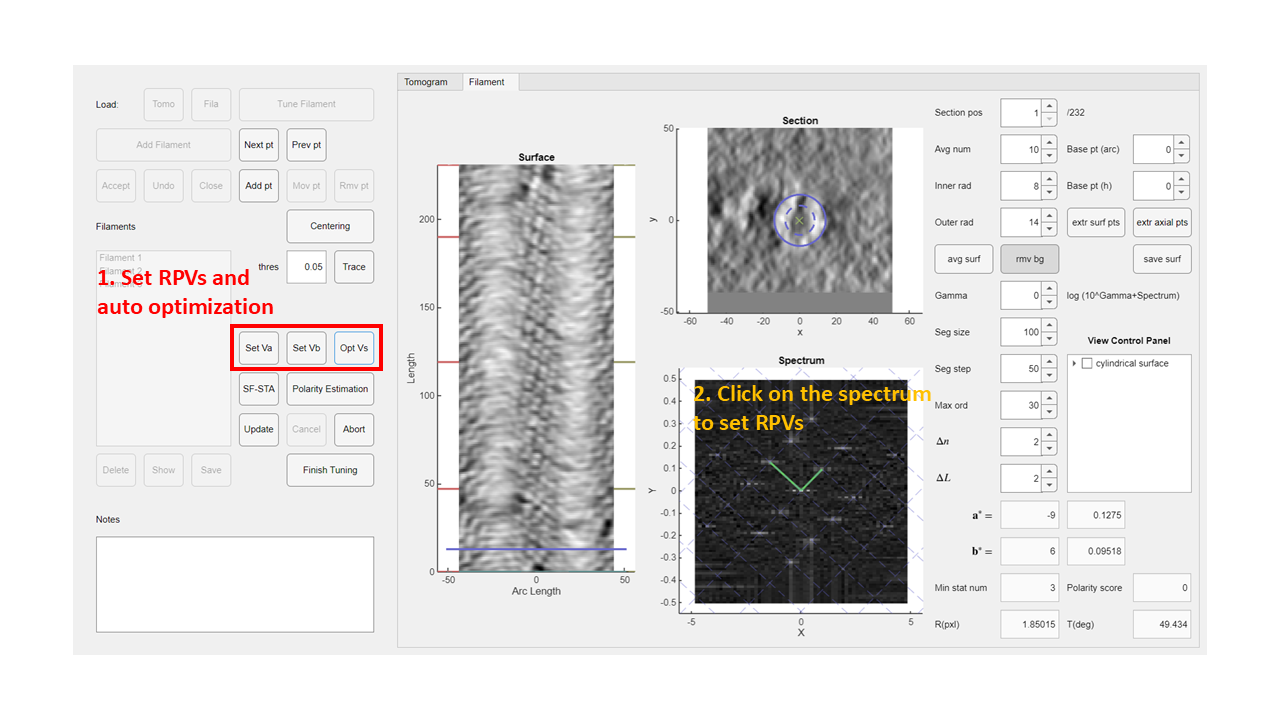
Determine Reciprocal Primitive Vectors and Helical Parameters
Set Va and Set Vb buttons: manually set 1st or 2nd reciprocal primitive vectors.
- Select points on Fourier spectrum.
Opt Vs button: optimize manually specified vectors.
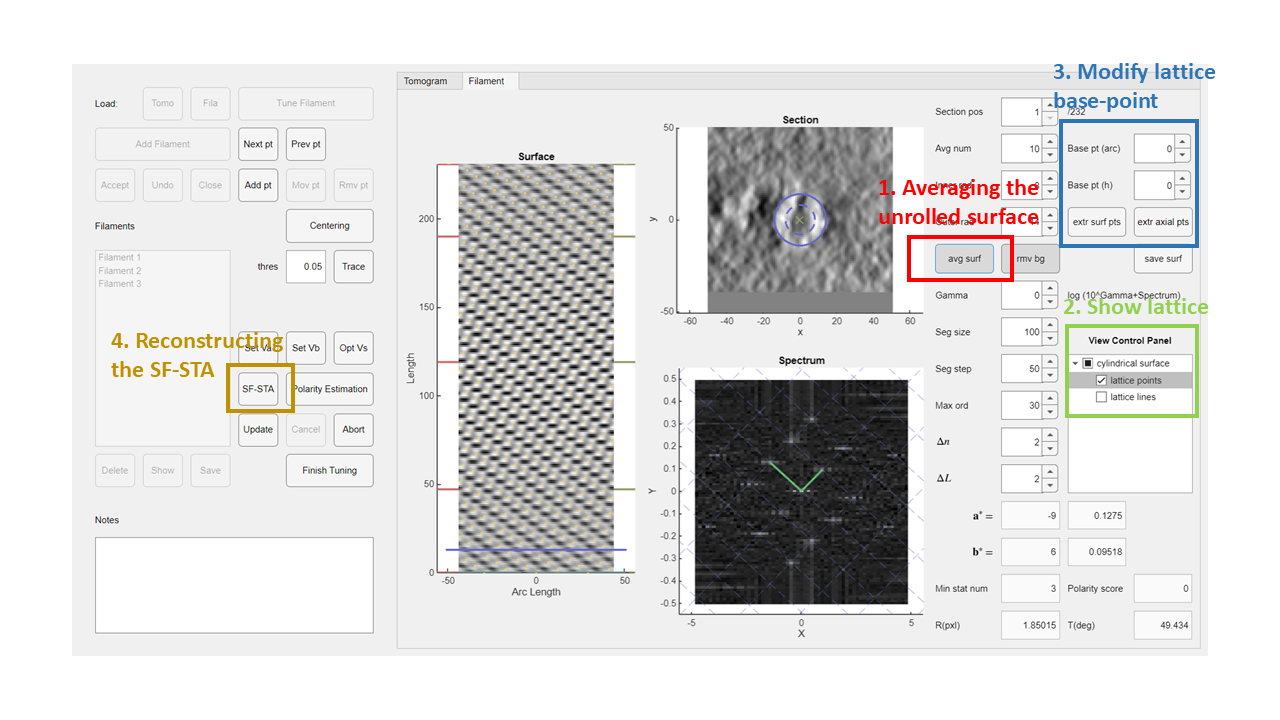
Averaging
Avg Surf button: average the unrolled surface.
View Control Plane: check to show corresponding graphics.
Base pt edit box: set the reference point for lattice.
- lattice lines and lattice points will be shown according to the base point.
- surface point extraction will based on the base point.
extr surf pts button: export the position and euler angles of asymmetric units.
- Useful in the down-stream tasks, like sub-tomogram averaging.
extr axial pts button: export the position of points in filament axis.
- Useful in the for down-stream tasks, like sub-tomogram averaging.
SF-STA button: reconstruct SF-STA of tuned filament.
Calculation of Polarity Score
Polarity Estimation button: calculate the polarity score.
- Select the reference map and the STA map of current filament to calculate.
- The result will be shown in
Polarity scoreedit box in the bottom-right part of the GUI.